 BROWSER-BASED TIME STUDY PLATFORM & VIDEO SOFTWARE
Data Analysis Tool Built For Automotive Manufacturers
- 47%
- Faster Studies
- 90%
- Workload Automated
- 0
- MANUAL CALCULATIONS REQUIRED
- 17+
- FULLY CUSTOMIZABLE SUBSTATES
The Manual Process Consisted Of Two IssuesTime & Truth
Before — stopwatch, clipboard, and multiple open tabs
- Video scrubbed by hand after the run, timestamps read off playback and written down before the next state change passes.
- Stopwatch runs separately from the footage, leading to two time sources that never fully agree.
- Substates named differently depending on who ran the study, cycle boundaries drawn inconsistently.
- Raw times transcribed into Excel by hand, durations calculated manually.
- Balance chart built column by column in a separate file before anything can be presented.
- Multiple hours per station, most of it administration rather than analysis.
After — one workspace, one export
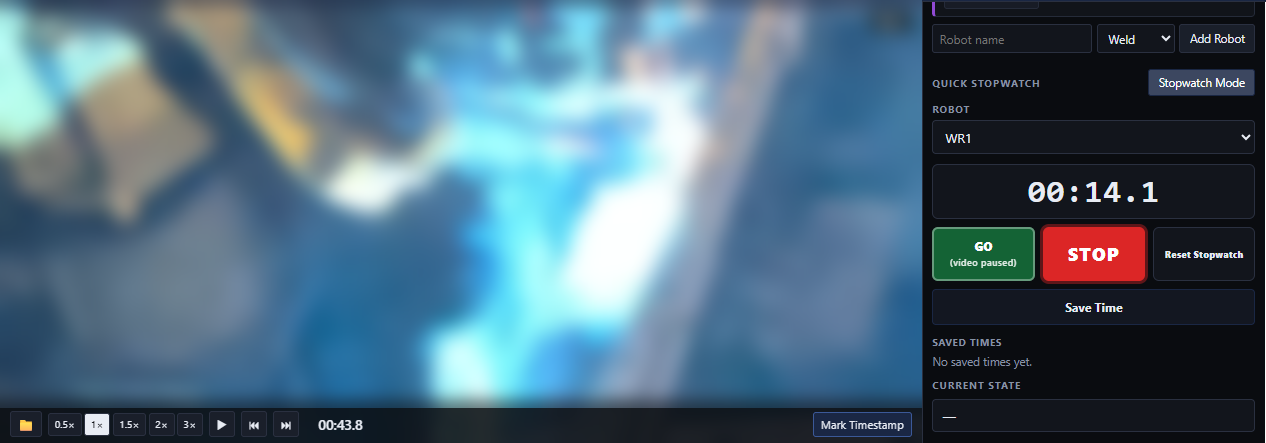
- Engineer loads footage, registers robots, and runs through the video once. The user selects the robot, category, and clicks start/stop while watching the video to gather accurate durations.
- Every event is stamped against the video timeline, resolving to a tenth of a second.
- Structured category and substate buttons replace handwriting — naming is consistent across every study.
- Yamazumi chart, event log, and export are generated automatically when the last robot is finalized.
- No manual math, no chart to build, no files to reconcile.
- Users can upload files back into the software to resume working, update, edit, and delete any information that is needed.
- Across controlled tests on a single operation, completion time dropped by roughly 47%. The reduction came from eliminating every step that was not the actual observation.
Entire Workflow In One Workspace
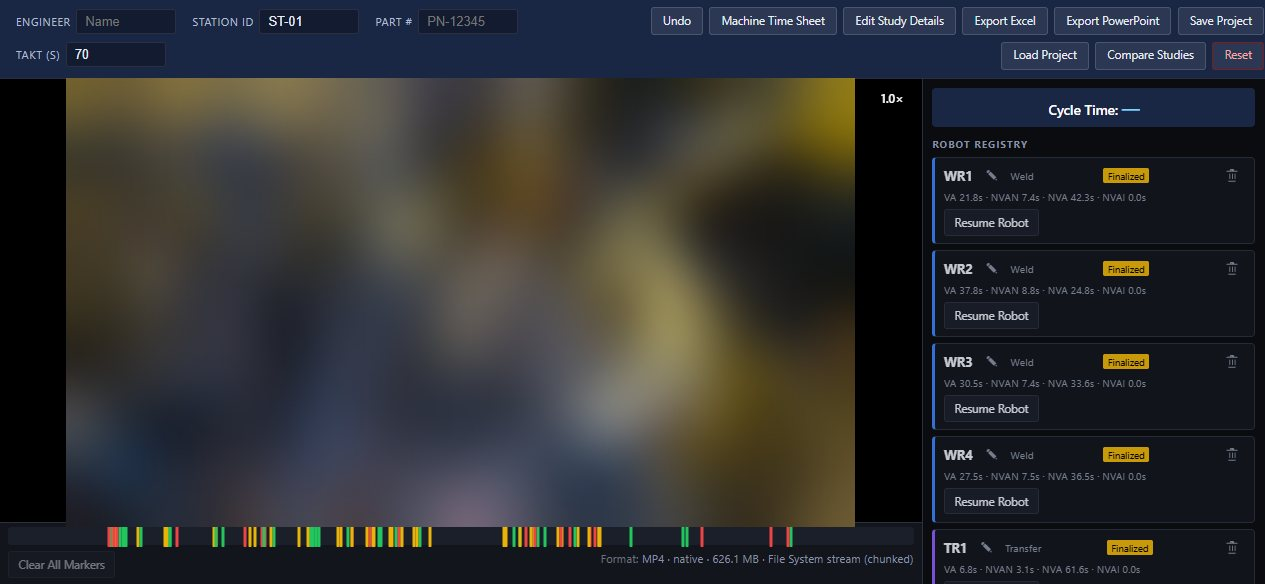
Frame-Level Video Control
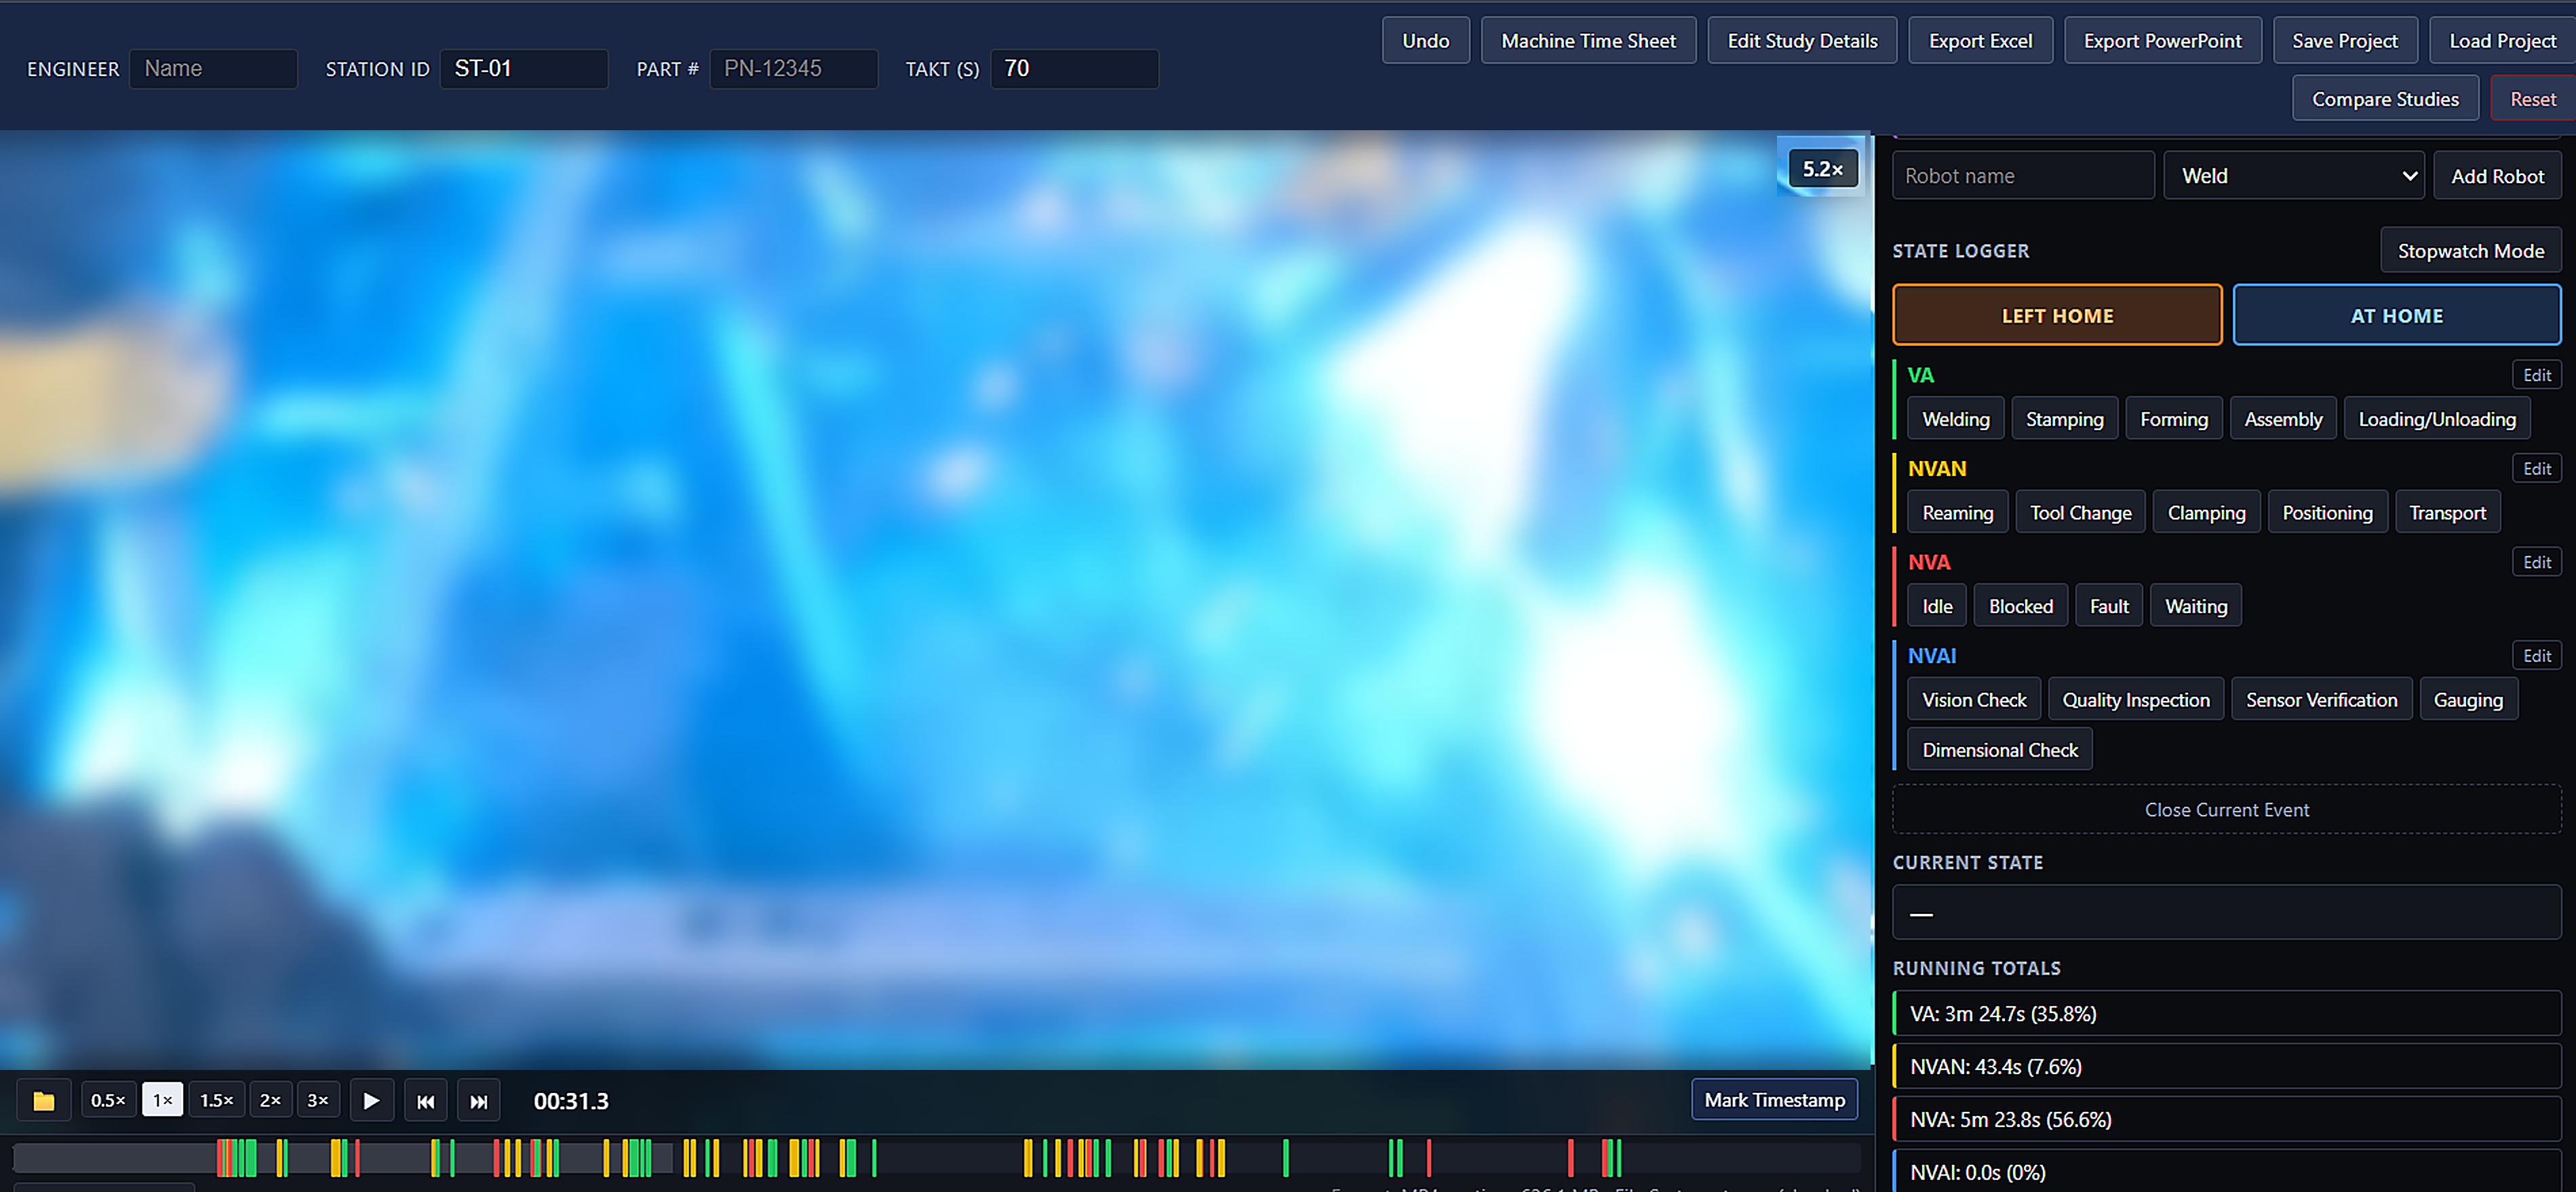
Zoom up to 8x, pan across the cell, annotate and draw directly on the frame, and slow down or speed up playback to 3x to catch state changes to the video frame.
Multi-Robot Registry
Weld, transfer, vision, bracket, combo robots, etc. All robots are registered per station, each tracked independently with their own event stream and running totals.
Four Lean States, Real Substates
Every logged event is classified as VA, NVAN, NVA, or NVAI with a specific substate such as welding, positioning, tool change, blocked, or dimensional check. Buttons are fully customizable, add or remove substates per category so the taxonomy matches the cell.
Home-Position Cycle Detection
Left Home and At Home markers set cycle boundaries automatically, so cycle time is derived from the study itself rather than entered by hand.
Study Intelligence
Waste report, cycle analysis, and takt status run on demand against the logged data. No export round trip required.
One-Click Reporting
Excel, PowerPoint, and PDF export with summaries, robot analysis, event log, and generated yamazumi data. Users can save and reload prior studies for side-by-side comparisons.
Time Study, Visuals, Data, Event Log On One Screen.
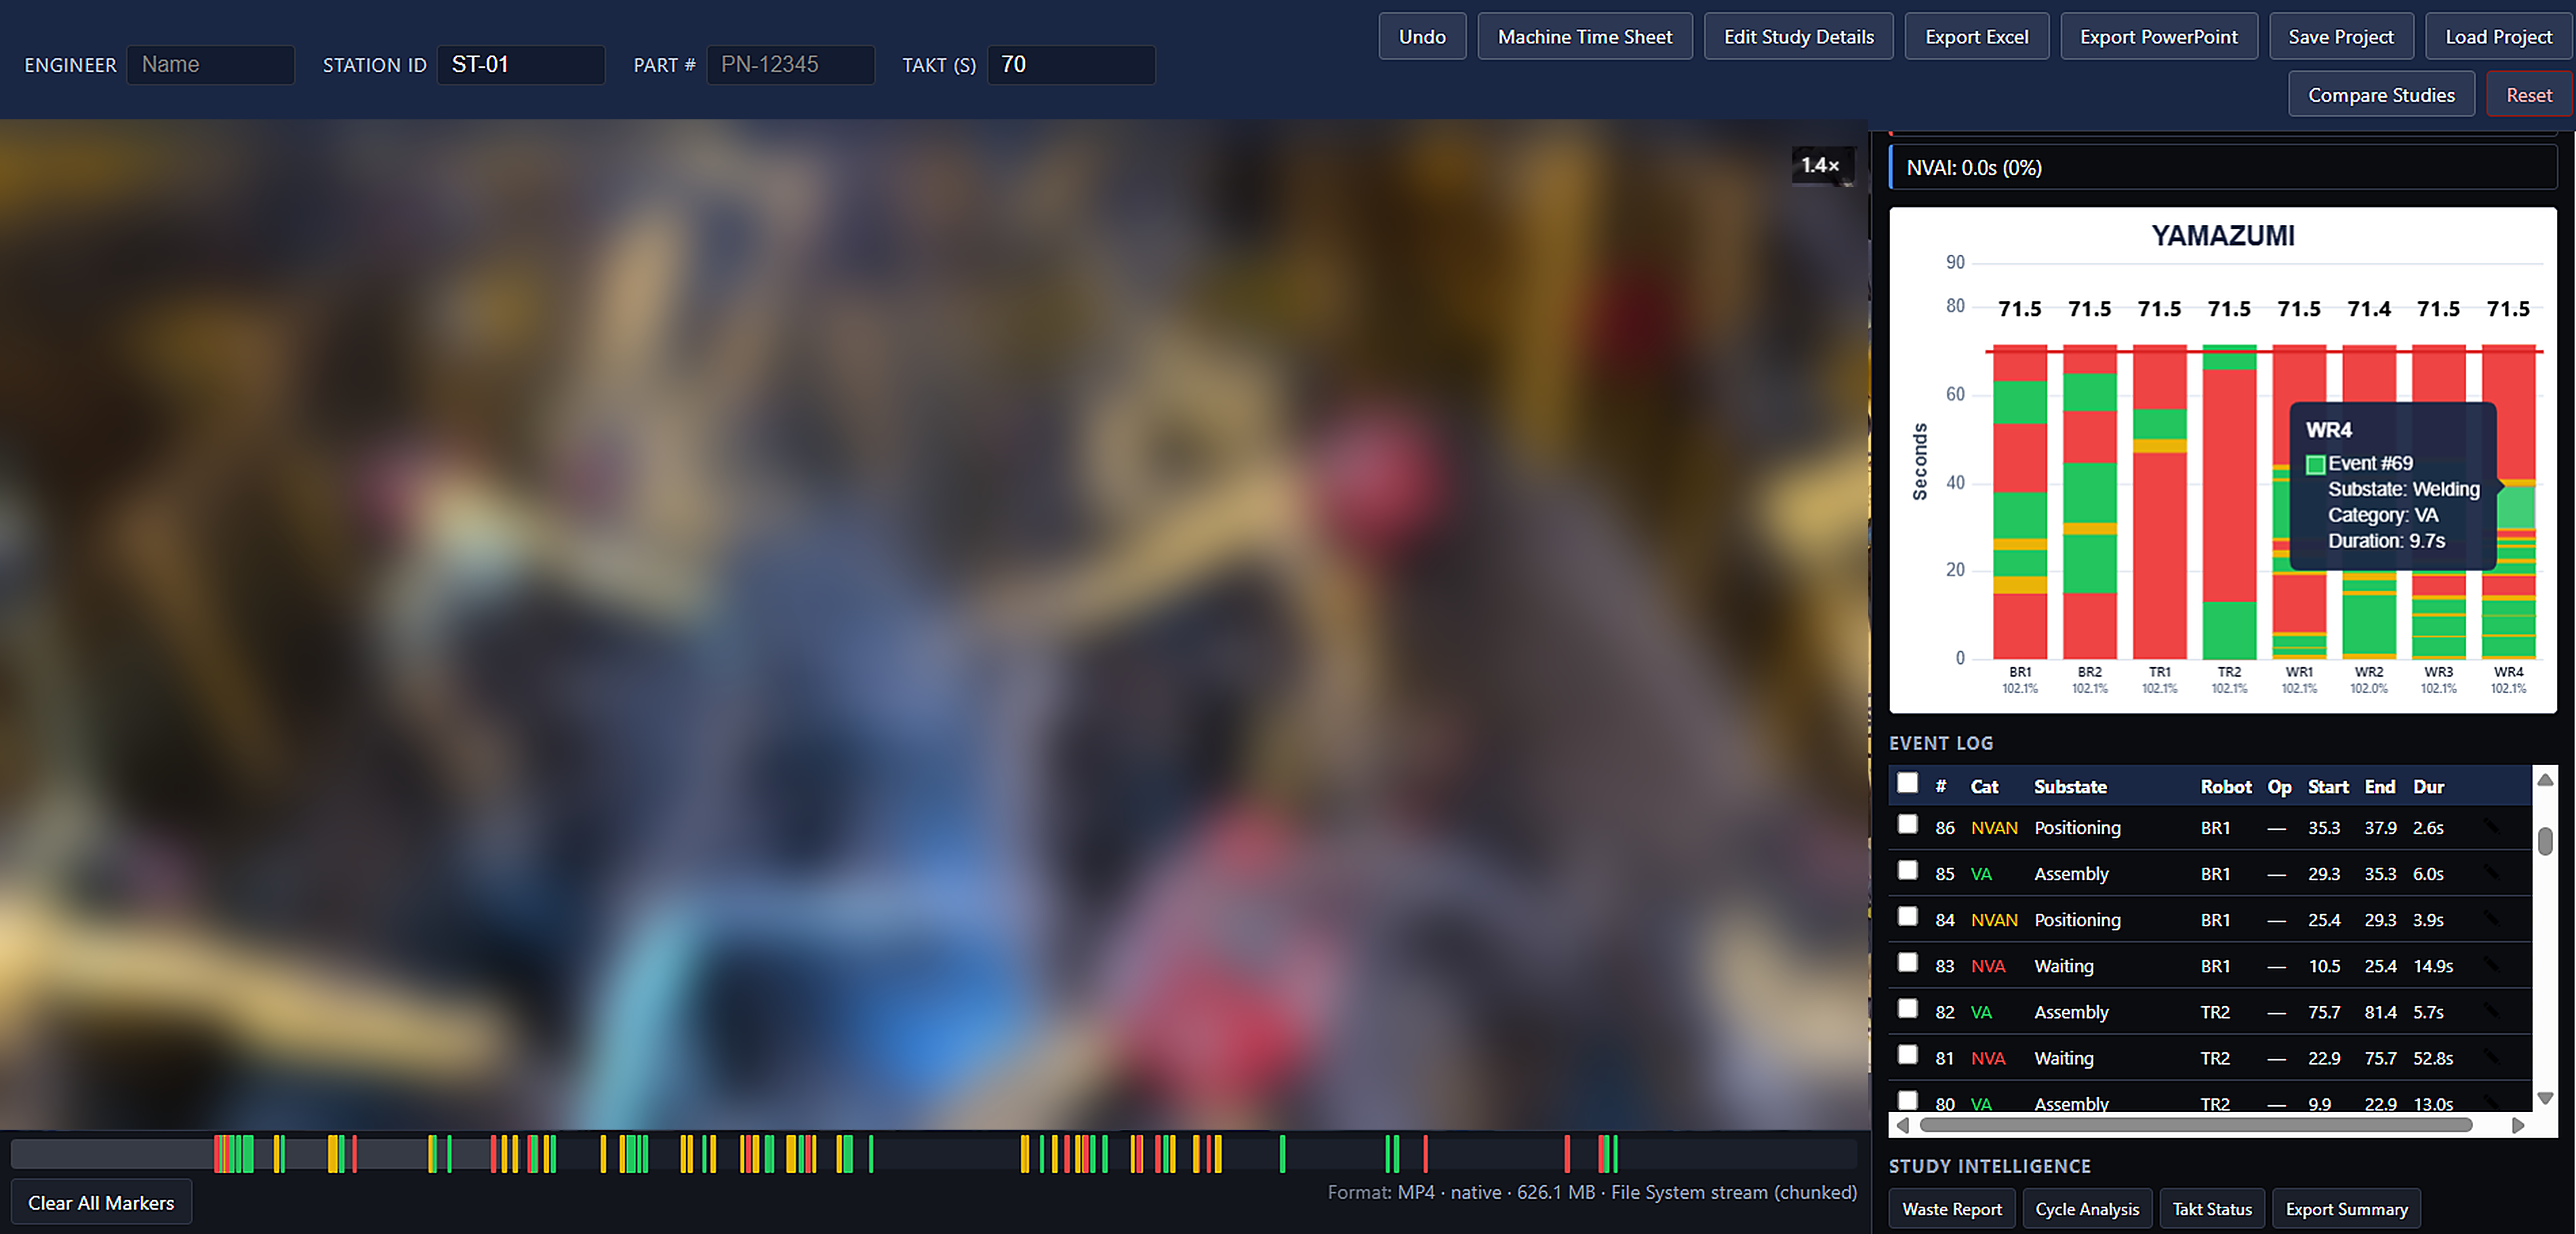
Nothing is entered twice. As the footage plays, the event log, the per-robot totals, and the balance chart update naturally so the engineer running the study is reading results, rather than transcribing them.
Single clock
Timing is stamped against the video timeline, so any figure can be replayed and re-checked frame by frame.
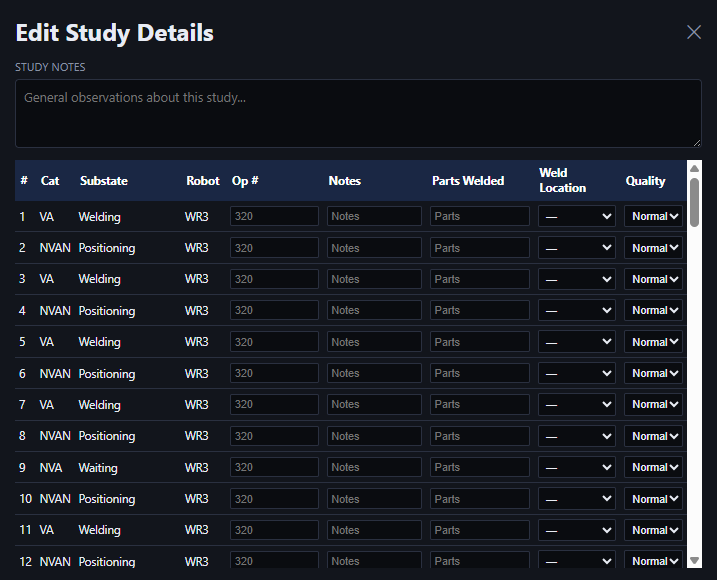
Editable, not rigid
Categories, substates, and row detail are all editable, so the taxonomy matches the cell rather than the tool.
Traceable by row
Every second in the chart resolves to a numbered event with a start, an end, and a robot attached to it.
From Logged Events To a Professional Visual
The software automatically generates a complete Yamazumi chart as a byproduct of logging. There is no second step, no manual chart build, no Excel formatting. The output is ready to present upon export.
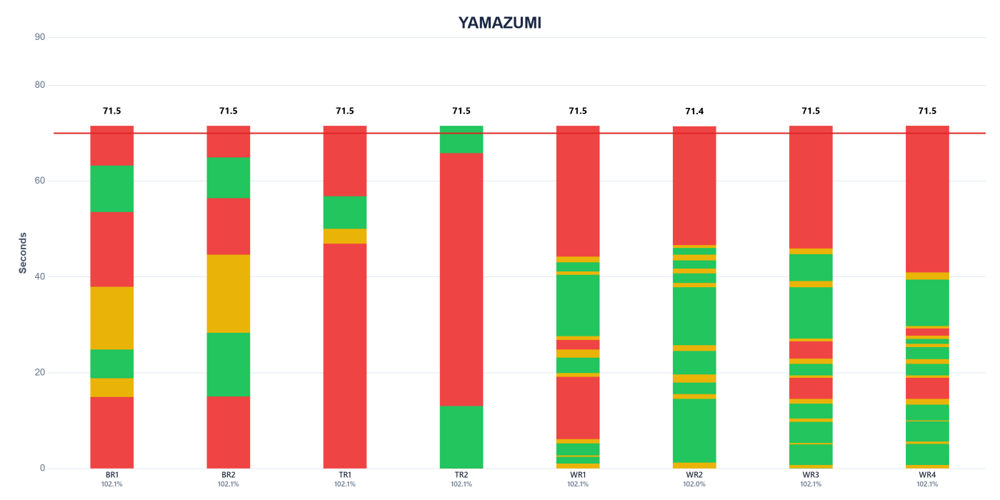
Exported balance chart: eight robot columns against the red takt line at 70 seconds, with utilization printed under each column.
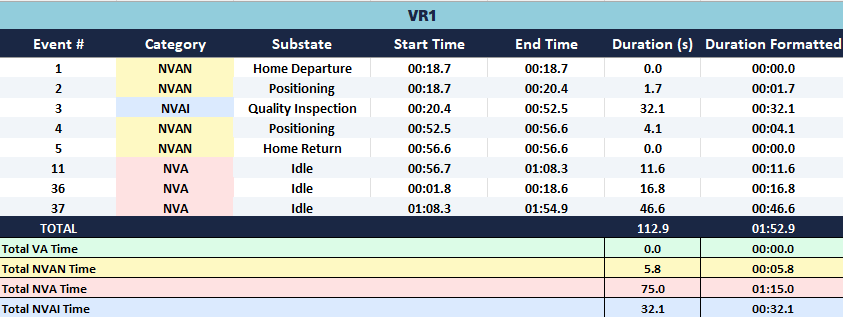
Each Robot Gets Its Own Detailed Analysis
Video Player Complete with Zoom and Video Speed Playback
- Welding
- Stamping
- Forming
- Assembly
- Loading/Unloading
- Reaming
- Tool Change
- Clamping
- Positioning
- Transport
- Idle
- Blocked
- Fault
- Waiting
- Vision Check
- Quality Inspection
- Sensor Verification
- Gauging
- Dimensional Check
47%
Faster than the manual baseline end to end, including report formatting.
±0.1s
Event timing resolution, stamped against the video clock not a stopwatch.
100%
Every figure traceable to a source event in the timestamped log.
Validated by running built-in stopwatch mode in parallel with video-synced logging on the same footage and cross-checking against studies completed by hand.
Client-Side By Design. No Data Is Saved, No Data Is Shared
A fully client-side single-page application. Video is read locally in the browser and never uploaded, which keeps recorded footage on the machine it was captured on, and means a study runs on a laptop with no network at all.